You're standing in the kitchen with a pound of raw chicken, and the recipe calls for two cups of cooked. Or you're at the grocery store trying to figure out how much pork shoulder to buy for pulled pork sandwiches. Or you're tracking macros, and your meal plan says "5 oz cooked chicken breast" but the package weight is raw.
This is the math that trips up almost every home cook eventually. And the answer isn't a single shrinkage number — it depends entirely on what protein you're cooking.
Jump to:
- Quick Answer: How Much Does Meat Shrink When Cooked?
- Raw to Cooked Weight Calculator
- Why This Calculator Is Different
- The 25% Shrinkage Myth, Busted
- Real-World Recipe Examples
- Doneness Chart for Steaks and Roasts
- Shrinkage by Cooking Method
- Why Meat Shrinks When Cooked
- Common Mistakes and Troubleshooting
- FAQ
- Final Thoughts
- Related
- Pin to Pinterest
Quick Answer: How Much Does Meat Shrink When Cooked?
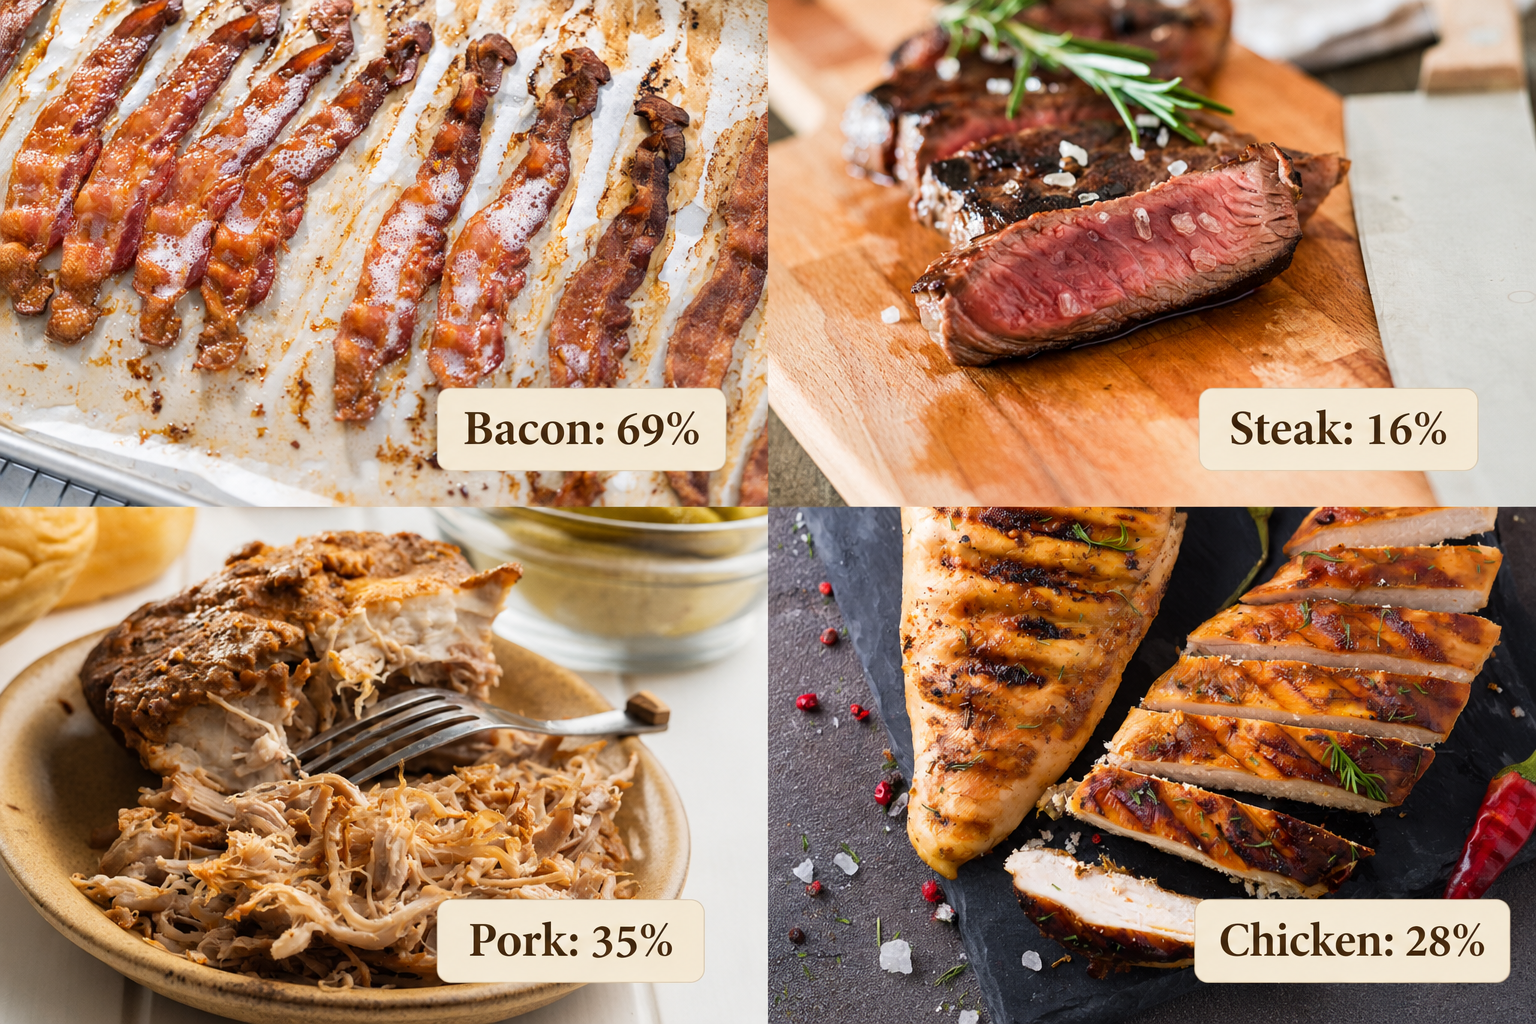
Raw meat loses 20% to 70% of its weight when cooked, depending on the protein. Bacon loses about 69%. Steaks lose as little as 16%. Most chicken and ground meats fall in the 20–30% range. There is no universal shrinkage number — every protein behaves differently.
Most Common Cooking Yields
Here's what one pound (16 ounces) of raw meat actually becomes after cooking:
Yields shown reflect the standard cooking method for each protein per USDA data — chicken roasted, steaks grilled, ground meats pan-broiled, pork shoulder braised, bacon pan-fried. For variations by method, see the Shrinkage by Cooking Method section below.
| Protein | Yield | Shrinkage | 1 lb raw becomes |
|---|---|---|---|
| Ribeye steak (boneless) | 84% | 16% | 13.4 oz cooked |
| Strip steak | 82% | 18% | 13.1 oz cooked |
| Salmon fillet ★ | 80% | 20% | 12.8 oz cooked |
| Pork tenderloin | 80% | 20% | 12.8 oz cooked |
| Ground beef, 93/7 | 77% | 23% | 12.3 oz cooked |
| Prime rib roast (bone-in) | 77% | 23% | 12.3 oz cooked |
| Chicken wings (whole) | 74% | 26% | 11.8 oz cooked |
| Ground beef, 80/20 | 73% | 27% | 11.7 oz cooked |
| Chicken breast (boneless/skinless) | 72% | 28% | 11.5 oz cooked |
| Shrimp (peeled, raw) ★ | 72% | 28% | 11.5 oz cooked |
| Chicken thighs (boneless/skinless) | 69% | 31% | 11.0 oz cooked |
| Ground turkey, 93/7 | 69% | 31% | 11.0 oz cooked |
| Pork shoulder (pulled pork) | 65% | 35% | 10.4 oz cooked |
| Bacon | 31% | 69% | 5.0 oz cooked |
★ Salmon and shrimp are based on industry food-science estimates because the USDA hasn't published official cooking yields for them. Every other number comes directly from USDA research.
Note: yields shown are cooking yields (raw weight → cooked weight). For bone-in cuts like prime rib, wings, and bone-in pork shoulder, the meat actually on the plate will be lower because of bones and trim — see the meat per person guide for edible-yield math when serving a crowd.
The calculator below handles the math for any amount, in either direction — raw to cooked or cooked to raw. For the full party-planning picture once you've sorted your meat amounts, the meat per person guide covers crowd quantities for any event size.ze.
Raw to Cooked Weight Calculator
Use this calculator to find out how much your meat will shrink when cooked — or how much raw to buy if your recipe gives you a cooked target. Works for any amount, in ounces, pounds, or grams.
RAW TO COOKED CALCULATOR
Find out exactly how much your meat will shrink — and how much raw to buy — for any protein, based on USDA cooking yield research.
| Step | Weight | Notes |
|---|
| Protein | Yield | Shrinkage | 1 lb raw becomes |
|---|---|---|---|
| Chicken breast | 72% | 28% | 11.5 oz cooked |
| Chicken thighs | 69% | 31% | 11.0 oz cooked |
| Chicken wings | 74% | 26% | 11.8 oz cooked |
| Ground beef 93/7 | 77% | 23% | 12.3 oz cooked |
| Ground beef 80/20 | 73% | 27% | 11.7 oz cooked |
| Ribeye steak | 84% | 16% | 13.4 oz cooked |
| Prime rib roast | 77% | 23% | 12.3 oz cooked |
| Pork tenderloin | 80% | 20% | 12.8 oz cooked |
| Pork shoulder | 65% | 35% | 10.4 oz cooked |
| Bacon | 31% | 69% | 5.0 oz cooked |
| Salmon fillet★ | 80% | 20% | 12.8 oz cooked |
| Shrimp★ | 72% | 28% | 11.5 oz cooked |
| Ground turkey | 69% | 31% | 11.0 oz cooked |
Why This Calculator Is Different
Most "raw to cooked" calculators on the internet use a flat 25% shrinkage across every protein. That number is wrong for almost everything.
The yields in this calculator come from two USDA primary research datasets:
- The USDA Table of Cooking Yields for Meat and Poultry, which aggregated thousands of laboratory-controlled samples across beef, pork, chicken, turkey, and game meats, cooked using standardized protocols (specific temperatures, internal doneness, defined resting times). This is the source the USDA itself uses for its National Nutrient Database.
- The USDA Foundation Foods database, which publishes paired raw and cooked weights for hundreds of individual meat samples purchased from retail stores across the country. Each sample is weighed before and after cooking under standardized conditions.
Nearly all proteins in this calculator come directly from one of those two sources. The two exceptions — salmon and shrimp — are marked with a star (★) and use estimates from established food-science references. The USDA has not published cooking yields for either, so the calculator uses industry-standard numbers and the post tells you exactly where they come from.
You're not getting a generalization. You're getting the same numbers the USDA uses for its own nutrition data, applied to the specific protein you're cooking.
The 25% Shrinkage Myth, Busted
If you've ever Googled "how much does meat shrink when cooked," you've seen the same number repeated everywhere: 25%. It's on weight-loss sites, fitness blogs, meal-prep guides, and even some cooking sites. And it's wrong for almost every protein in this calculator.
The 25% figure traces back to a Weight Watchers article from years ago that said "meat, poultry and fish will shrink about 25 percent when cooked." That's a rough average across all proteins combined, in a single sentence written to make calorie tracking simpler. It was never meant to be applied to specific proteins. But it got repeated and re-repeated until it became "the rule."
Here's what the actual USDA data shows:
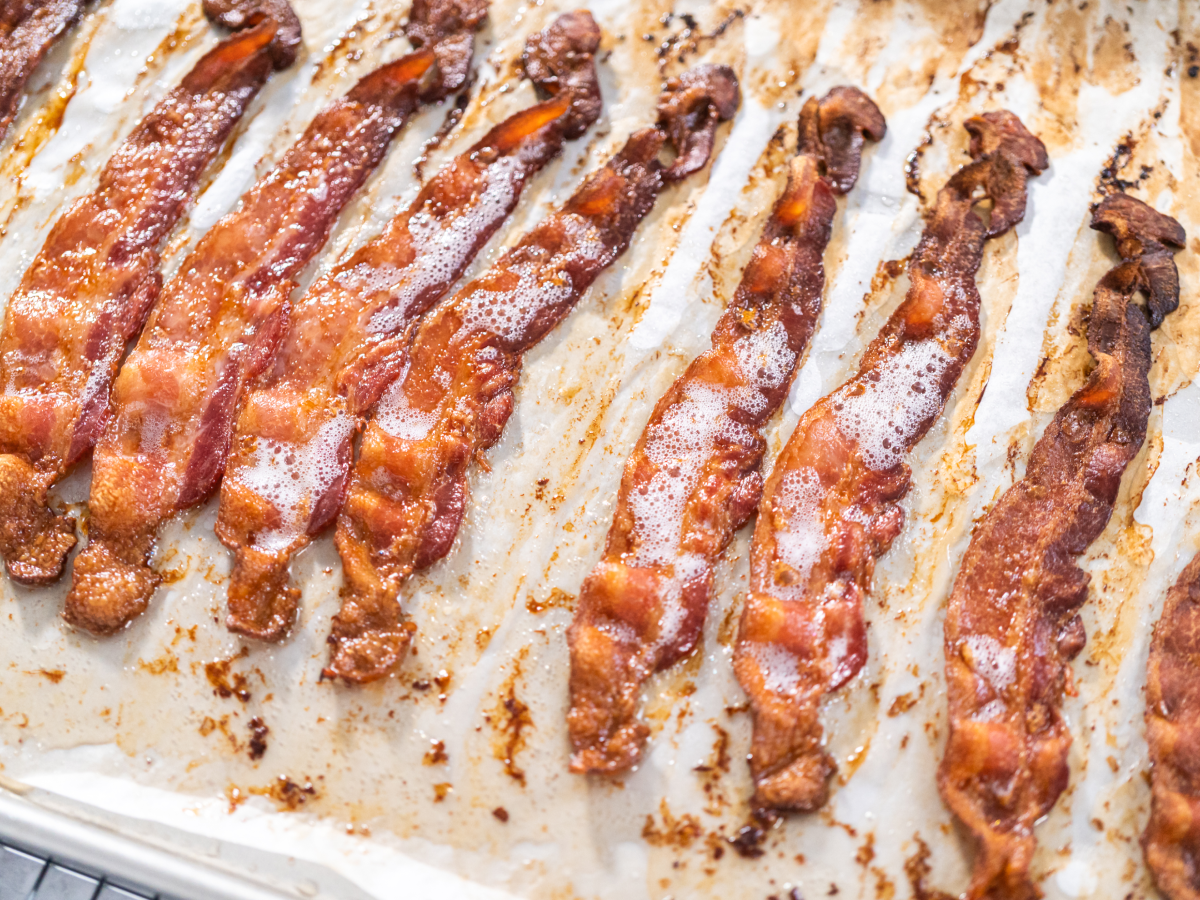
Bacon loses 69% of its weight when pan-fried. A pound of raw bacon — that's 16 ounces going in the pan — yields about 5 ounces cooked. If you've ever bought a pound of bacon thinking it would feed a brunch crowd and ended up with not enough, this is why. To end up with 1 pound of cooked bacon, you actually need to start with about 3.2 pounds raw.
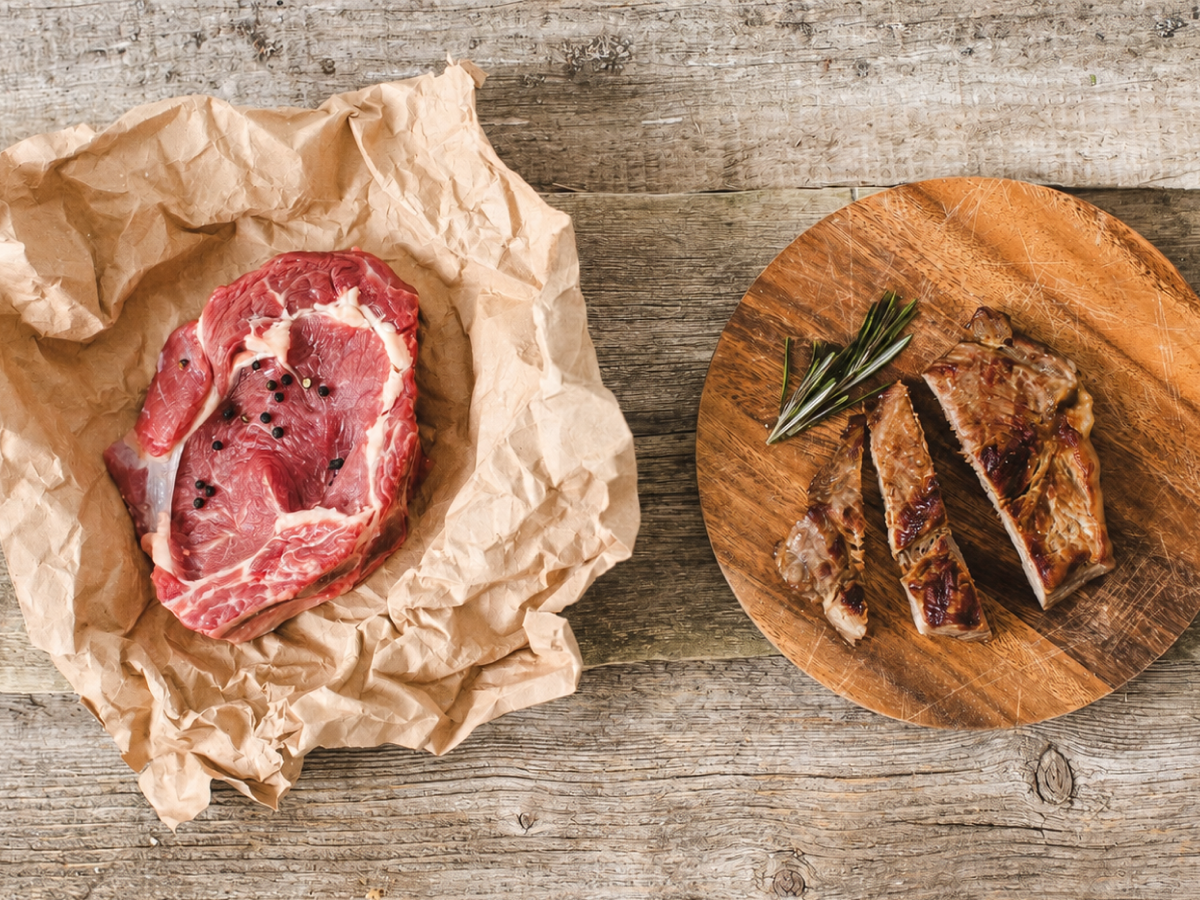
A boneless ribeye loses only 16% when grilled. That same one-pound steak comes off the grill at about 13.4 ounces. Much less shrinkage than ground beef or pulled pork — which is part of why a steak feels like a substantial portion even when the raw weight wasn't enormous.
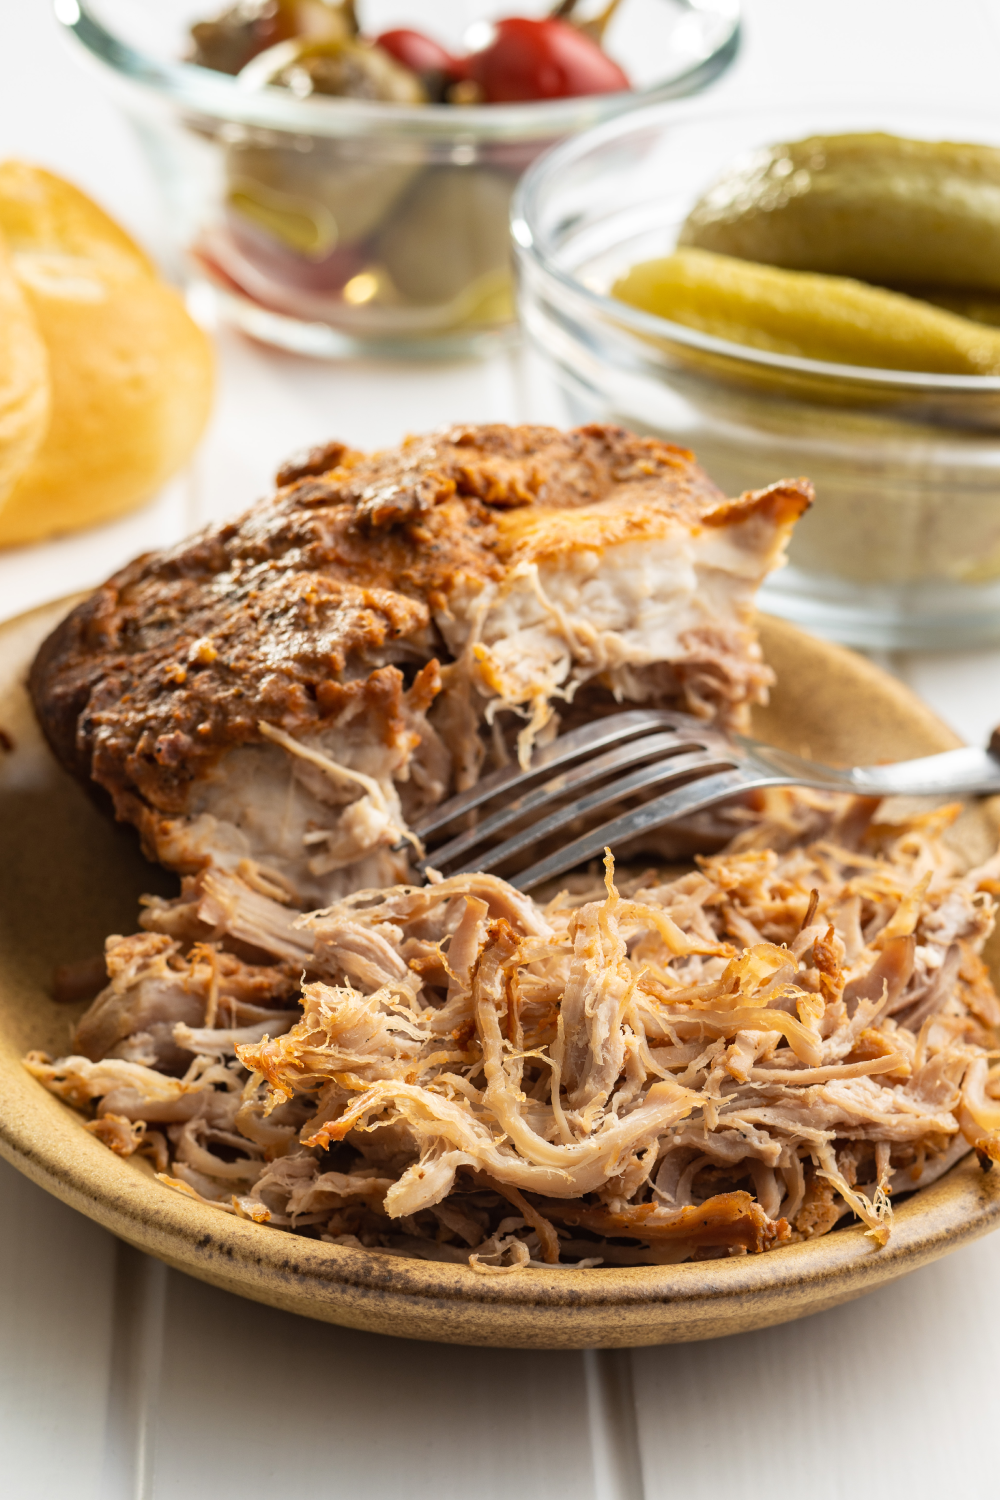
Pork shoulder loses 35% in a low-and-slow braise. This is exactly why hosting guides recommend buying 1.5 pounds of raw pork shoulder per pound of cooked pulled pork you want to serve. It's not generous overestimating — it's the math.
Ground beef shrinks differently depending on fat content. Lean 93/7 holds onto 77% of its weight. Fatty 80/20 holds onto 73%. The fattier the meat, the more weight rendered out during cooking — but the difference is real and measurable.
Treating all meat as "25% shrinkage" means you'll buy way too little bacon, slightly too much steak, and you'll consistently miss your macro targets on chicken. The protein-specific numbers in this calculator aren't a nice-to-have. They're the difference between a recipe that works and one that comes up short.
For the bigger picture on planning meat quantities for an actual party rather than a single meal, the meat per person guide walks through crowd-scale amounts using these same shrinkage principles.
Real-World Recipe Examples
Here's how the math plays out in situations you'll actually run into.
"Recipe says 1 lb cooked ground beef. How much raw do I buy?"
Most home recipes — chili, tacos, stuffed peppers, meatballs — list ingredients in cooked weight. The recipe doesn't care what fat content you use, but the math does.
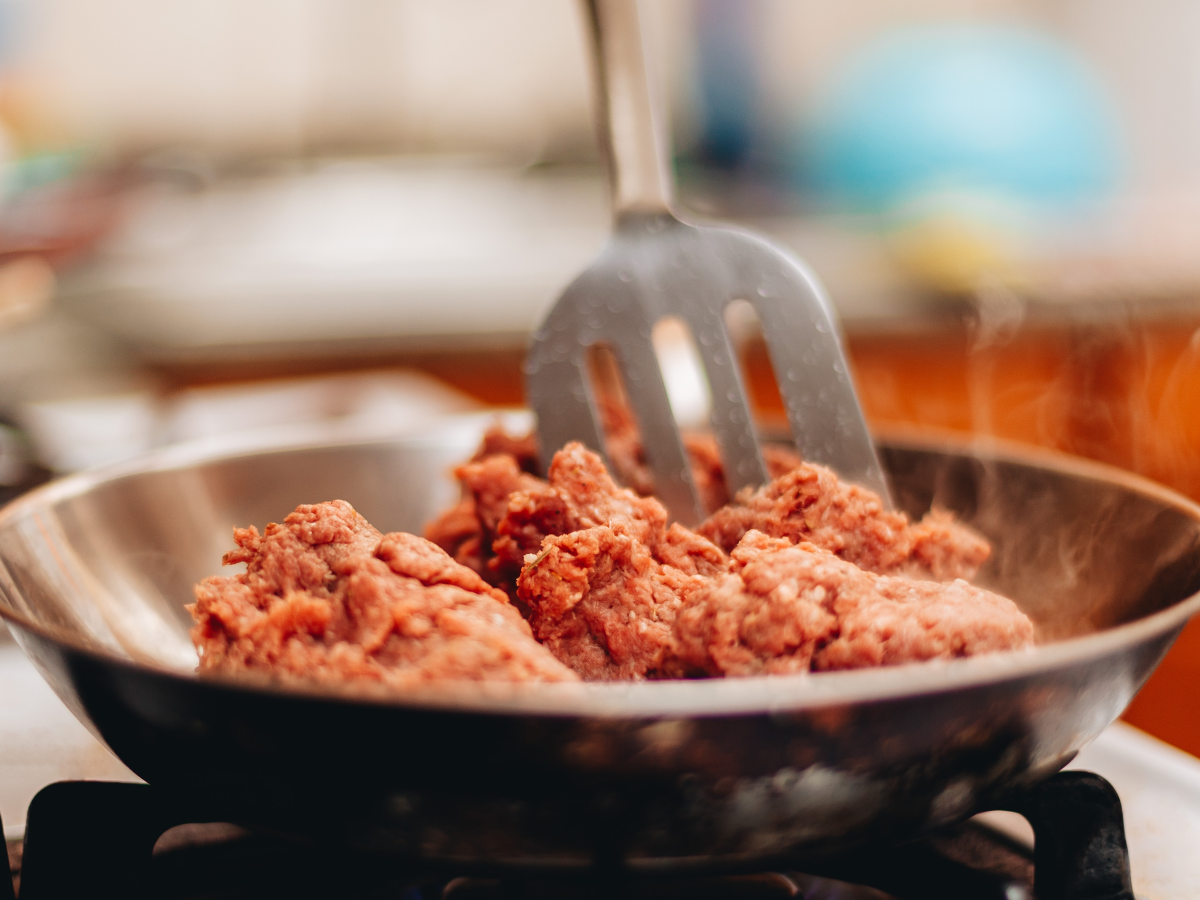
For 1 lb of cooked 80/20 ground beef, buy 1.37 lb of raw (about 22 oz, or a standard 1.5 lb package). For lean 93/7, buy 1.30 lb of raw. The difference is small, but for a recipe that's already on the edge of meat-to-everything-else, it matters.
Ground beef packages at the grocery store are always labeled by raw weight, not cooked yield — so if a recipe lists "1 lb cooked," that's the number you need to multiply, not the number printed on the package.
"I want to serve 4 people pulled pork. What do I buy?"
Plan on about ⅓ to ½ lb of cooked pulled pork per person on sliders or sandwiches. For 4 people at ½ lb each, that's 2 lbs of cooked pulled pork.
At 65% yield, you need 3.1 lb of raw pork shoulder — round up to 3.5 lb to give yourself a comfortable margin. If the shoulder is bone-in (which is typical and recommended for the best texture), the bone will account for another ½ to 1 lb you can't eat, so go with a 4 lb bone-in shoulder.
For more on slider portions specifically, the sliders per person guide has the full breakdown.
"I'm serving prime rib at a holiday dinner for 8 people. How much do I buy?"
Prime rib is the one protein where you should buy generously — leftovers reheat beautifully, and running short on a holiday roast is a moment no host wants. For 8 guests, plan ¾ to 1 lb of raw bone-in roast per person, which works out to 6 to 8 lb total. At your butcher counter, that's a 3 to 4-bone roast (each rib bone adds roughly 2 lb to the total weight, and prime rib is often ordered by bone count)
At 77% yield, that gives you about 4.6 to 6.2 lb of cooked roast (bone-in weight), or roughly 4 to 5.5 lb of carved edible meat once you account for the bones. That works out to ½ to ¾ lb of edible meat per person — a comfortable, satisfying portion with room for seconds. For the full holiday spread including sides and timing, the Thanksgiving dinner calculator handles the rest of the meal around your protein.
"I'm meal prepping 5 days of chicken. How much do I cook?"
For 5 lunches at 5 oz of cooked chicken breast each (a good portion size for most macro goals), you need 25 oz of cooked chicken total.
At 72% yield, that's 34.7 oz of raw chicken, or about 2.2 lb raw. Most grocery store chicken comes in packages of 1.5 to 2 lb, so grab one large pack or two small.
"How much raw bacon do I buy for 12 BLTs?"
Two strips of cooked bacon per BLT means 24 strips total. A typical cooked strip of bacon weighs about ⅓ ounce, so 24 strips comes to about 8 ounces of cooked bacon. At 31% yield, you need to start with 26 oz of raw bacon — round up to 2 lb (32 oz) to give yourself room for thicker strips or curling.
Bacon strip weights vary more than any other meat in this calculator. Standard-cut, thick-cut, and "center-cut" bacon all weigh differently per strip, and individual strips within the same package can vary by 30% in weight. This is the one place where buying a little extra is genuinely worth doing instead of estimating tight.
Doneness Chart for Steaks and Roasts
For ground meats and poultry, doneness is fixed by food safety — 160°F for ground beef, 165°F for chicken. There's no doneness range to worry about. But for whole-muscle steaks and roasts, the doneness you cook to changes the yield significantly.
A quick note on this chart: the USDA publishes cooking yields at one doneness level per cut (typically medium for steaks, medium-rare for roasts). The other doneness columns below are extensions of that, calculated using the well-documented food-science relationship between internal temperature and weight loss. The medium column is USDA-direct; the rare-through-well-done columns build out from it.
| Cut | Rare (125°F) | Med-rare (135°F) | Medium (145°F) | Med-well (155°F) | Well done (165°F) |
|---|---|---|---|---|---|
| Ribeye steak (boneless) | 90% | 87% | 84% | 80% | 76% |
| Strip steak (top loin) | 88% | 85% | 82% | 78% | 74% |
| Prime rib roast (bone-in) | 82% | 79% | 77% | 73% | 69% |
A 1-pound boneless ribeye loses 1.6 oz of weight cooked rare — but 3.8 oz cooked well-done. That's a meaningful difference if you're tracking macros, planning serving sizes, or just trying to figure out why your steak looked smaller than you expected after a long stay on the grill.
The takeaway: if you cook steaks past medium routinely, the calculator's medium-default numbers will under-predict your shrinkage by a few percentage points. Adjust accordingly.
Shrinkage by Cooking Method
Even within the same protein, different cooking methods give you different yields. The USDA data is broken out by method, and the gaps can be real.
| Protein | Method 1 | Method 2 | Method 3 |
|---|---|---|---|
| Ground beef 80/20 patty | Pan-broiled: 73% | Broiled/grilled: 69% | — |
| Ground beef 80/20 crumbles | Pan-fried: 67% | — | — |
| Chicken breast | Roasted: 72% | Poached/simmered: 77% | — |
| Chicken thighs (bone-in) | Roasted: 69% | Poached/simmered: 74% | — |
| Chicken wings | Roasted/baked: 74% | Deep-fried (floured): 66% | Poached: 86% |
| Bacon | Pan-fried: 31% | Baked: 32% | Microwaved: 29% |
| Pork tenderloin | Roasted: 80% | Roasted (enhanced/brined): 84% | — |
A couple of things worth noting: poaching and braising in liquid generally give you higher yields than dry-heat methods, because meat absorbs some moisture from the cooking liquid even as it loses some internally. And deep-fried wings shrink more than baked ones — the high heat plus fat loss into the oil compound the weight loss.
For the chicken wing calculator that handles crowd quantities for wings specifically, the chicken wings per person guide breaks down piece counts and pounds.
Why Meat Shrinks When Cooked
There are two physical things happening when meat shrinks. First, heat causes the protein strands inside the muscle to denature and tighten — the molecular equivalent of wringing out a wet sponge. The proteins squeeze out water that was being held inside the muscle structure. That water either evaporates from the surface or drips out into the pan as juice.
Second, fat renders. As the temperature inside the meat rises past about 130°F, the fat that's marbled through and around the muscle starts to liquefy. Some of that fat soaks back into the meat. Some of it drips away — into the grill, the pan, or the bottom of a roasting dish. Higher-fat meats lose more weight overall, but they also stay juicier because of how the rendered fat carries flavor through the muscle.
The combination is why 80/20 ground beef loses more weight than 93/7 — there's just more fat to render out — and why bacon, which is mostly fat, ends up at about a third of its starting weight.
Common Mistakes and Troubleshooting
A few things that trip people up when working with these numbers.
Buying "enhanced" or "with added solution" chicken. Check the package label. A lot of grocery-store chicken — especially Tyson and Perdue — is injected with up to 15% salt water to keep it juicy and extend shelf life. That extra water cooks out, which makes the meat appear to shrink more than non-enhanced chicken. If you're trying to hit accurate yields, look for "minimally processed" or "no added solution" on the label. The calculator's chicken numbers are based on non-enhanced poultry.
Weighing cooked meat while it's still hot. A hot piece of meat is still losing moisture for the first few minutes after it comes off the heat. For accurate macro tracking, let cooked meat rest for 3 to 5 minutes before weighing — this is the same window the USDA uses in its yield studies.
Frozen-then-thawed meat shrinking more than you expect. Freezing causes ice crystals to puncture cell walls in the muscle. When you thaw and cook, more water leaks out than from a never-frozen cut. Expect another 3 to 5 percentage points of shrinkage compared to fresh.
Confusing "cooking yield" with "edible yield." The numbers in this calculator are cooking yields — they account for what comes off the heat. Edible yield is different and lower, because it also subtracts bone, skin you don't eat, and gristle. For most boneless/skinless cuts the two are nearly identical. For a bone-in prime rib or whole chicken, cooking yield will be higher than what actually ends up on plates. The meat per person guide accounts for edible yield specifically when calculating party portions.
Using cooked weight for nutrition tracking when your label is raw. Nutrition labels on raw chicken, beef, and pork are based on raw weight. If you weigh after cooking and look at the package label, your calorie and protein numbers will be wrong. Either weigh raw consistently, or look up the cooked nutrition data separately.
FAQ
How much weight does meat lose when cooked?
Between 16% and 69% depending on the protein and cooking method. Steaks lose the least (15–20%), most chicken and ground meat loses 25–30%, pork shoulder loses 35%, and bacon loses about 69%.
Should I weigh meat raw or cooked for nutrition tracking?
Whichever you do, do it consistently. Most USDA nutrition data is published for raw weight, so weighing raw and using the package label is the most accurate approach. If you weigh cooked, look up the cooked nutrition data separately rather than applying raw-meat numbers to a cooked portion.
How much raw chicken do I need for 4 cups of cooked, shredded chicken?
About 1.5 pounds of raw boneless/skinless chicken breast. Four cups of shredded chicken weighs roughly 1.1 lb, and at 72% yield that's about 1.5 lb of raw.
Why does ground beef shrink more than steak?
Two reasons. First, ground beef has more surface area exposed to heat, so moisture evaporates faster. Second, the typical ground beef fat content (15–20%) is higher than a typical steak's intramuscular fat, so more fat renders out during cooking.
Does cooking method matter more than the cut?
For shrinkage purposes, the cut and fat content matter more, but cooking method does play a real role. Wet-heat methods like poaching and braising generally yield 4–7 percentage points more than dry-heat methods like roasting or grilling, because some moisture transfers from the cooking liquid back into the meat.
Why does bacon shrink so dramatically?
Bacon is roughly 40–50% fat. As the bacon cooks, almost all of that fat renders out into the pan, plus a significant amount of water that was being held in the muscle and curing solution. What's left is mostly the protein and a small amount of fat that stayed in the meat — about 30% of the starting weight.
Is the USDA yield data accurate for grass-fed or pasture-raised meat?
It's a reasonable starting point, but not exact. Grass-fed beef typically has less marbling than conventional beef, which means slightly higher cooking yields (less fat to render out). Pasture-raised chicken often has slightly lower yields than conventional chicken because of denser muscle structure. Expect a few percentage points of variance in either direction.
Final Thoughts
The single most useful thing about this calculator isn't any one number — it's that it puts a stop to the "I'll just buy a pound and hope" approach to cooking. Meat is the most expensive part of almost every grocery run, and getting the math right means less waste, fewer trips back to the store, and a recipe that actually works the way it's supposed to.
A few quick rules of thumb worth keeping:
- For most chicken and ground meats, plan to buy about 1.3 to 1.5 times the cooked weight you want.
- For pulled pork, buy about 1.5 times the cooked weight (plus extra for bone if you're going bone-in).
- For steaks, buy about 1.2 times the cooked weight you want on the plate.
- For bacon, buy roughly 3 times your target cooked weight. Yes, really.
Planning for a Crowd?
Cooking for a party rather than a single meal? Use this calculator to convert raw amounts before shopping, then jump to the right party calculator for crowd quantities:
- Taco bar calculator — convert raw ground beef to cooked yield, then scale toppings, tortillas, and sides by guest count
- Burgers per person calculator — find raw beef pounds for any cooked patty size at any crowd size
- Sliders per person calculator — same math, smaller portion, more sliders per pound
- Chicken wings per person calculator — convert raw wing pounds, then crowd-scale for game day or party platters
- Thanksgiving dinner calculator — turkey shrinkage plus every side dish for any holiday crowd
- Meat per person guide — the master reference for edible meat amounts by event type
- Full party food planning guide — every protein, every event size, all in one place
Bookmark this calculator. Next time a recipe gives you cooked weight and your package is labeled raw — or you're standing at the meat counter trying to figure out how much to buy — you'll have the math in 10 seconds instead of doing the guess-and-pray.
Related
Looking for other recipes like this? Try these:


Pin to Pinterest